
In this article, you will learn about cardiac preload vs afterload vs contractility. These three factors are the most important in determining stroke volume (SV). Stroke volume affects the cardiac output.
In addition, you will also learn a few important cardiac terminologies with definitions, normal ranges, formulas, and examples to apply the formula.
What is cardiac preload?
Preload is one of three major factors that directly affect stroke volume (SV). The other 2 factors that affect stroke volume are afterload and contractility.
Cardiac preload refers to the degree of the ventricular stretch at the end of the diastole just before contraction (or systole).
Preload is directly proportional to the end-diastolic volume (EDV), which is the volume of blood in the ventricles at the end of the diastole.
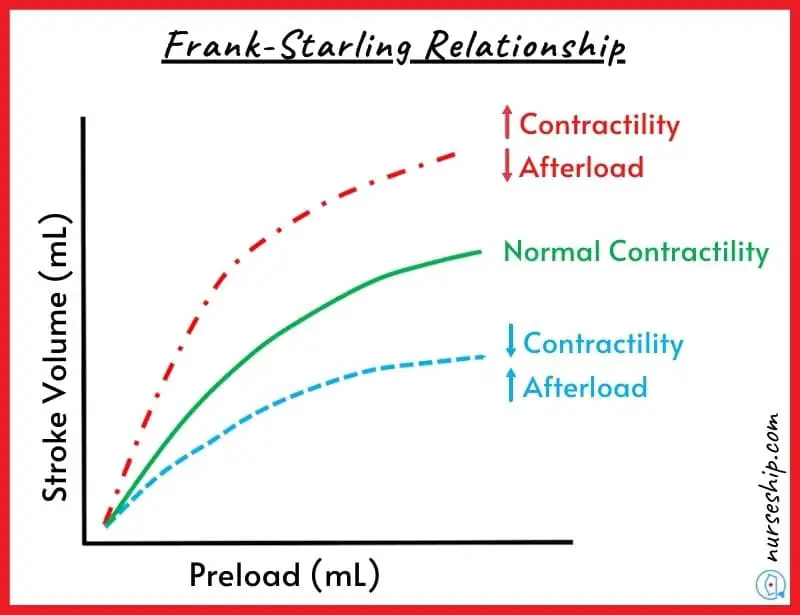
The degree of stretch that cardiac muscle fibers are subjected to influences the force with which they contract during systole (the greater the stretch, the greater the force). This phenomenon is called the Frank-Starling law of the heart.
The most important factors in preload are venous return and the rate of filling.
Venous return refers to the amount of blood that returns to the heart during the diastolic phase. The rate of filling refers to the amount of time it takes to fill.
Cardiac preload is affected by changes in venous tone and circulatory blood volume. Any changes in these factors have an effect on cardiac output and overall heart function.
How to increase preload?
The preload is increased when the volume of the blood returning to the heart (venous return) is increased.
This can be achieved by simply administering the intravenous fluids, which increase the blood volume returning to the heart, which ultimately causes an increase in the stretch on ventricles (i.e., increase preload).
Preload can also be increased by administering drugs that stimulate the sympathetic nervous system. This is achieved by the drugs which promote vasoconstriction (narrowing of the vessels).
How to decrease preload?
The preload can be decreased by administering diuretics like furosemide (as achieved pharmacologically in heart failure patients).
In this scenario, diuretics help the kidneys to excrete excess water from the blood via urine. As a result, the blood volume is decreased and therefore the preload is reduced.
Another way to decrease the preload is through vasodilatation (widening of the vessels). As the vasoconstriction increases the preload, vasodilation decreases it.
This can be achieved by using vasodilation agents like nitroglycerine (nitrates). This decreases the blood volume returning to the ventricles and decreases the stretch on the ventricles, ultimately decreasing the preload.

Human Anatomy & Physiology Course
- Guidebooks
- Complete Diagrams & Lessons
- Certifications
- Quiz & Answers
- And More…
What is the effect of preload on cardiac output?
A decrease in preload decreases ventricular contraction force and stroke volume. Hence, cardiac preload has a direct effect on cardiac output.
This means that decreased preload decreases cardiac output while increased preload increases cardiac output.
What are the factors affecting cardiac preload?
Several factors affect the cardiac preload. Following the factor that increases and decreases the heart’s preload.
What are the factors that increase cardiac preload?
The factor that leads to increased cardiac preload are:
- Valve defects and systolic ventricular failures like aortic regurgitation and aortic stenosis.
- Increased aortic pressure.
- Reduced heart rate.
- Increased force of atrial contraction by the Frank-Starling mechanism.
- Increased compliance of the ventricles results in increased chamber expansion during filling at a filling pressure.
- Increased central venous pressure can occur due to increased blood thoracic volume and reduced venous compliance.
- Gravity (e.g., prolonged head-down tilt).
- Increased skeletal muscle pump activity.
- Increased respiratory activity.
- Increased venous return or blood volume due to any cause increases preload.
What are the factors that decrease cardiac preload?
The factor that leads to decreased cardiac preload are:
- Stenosis of the inflow (mitral and tricuspid) valves, resulting in decreased ventricular filling.
- Ventricular diastolic dysfunction can be caused by ventricular hypertrophy or impaired relaxation (lusitropy).
- Reduced ventricular afterload increases blood flow (i.e., ejection), thereby reducing end-diastolic and end-systolic volumes secondary to reducing end-systolic volume.
- Increased heart rate.
- Atrial arrhythmias.
- Reduced venous blood pressure, which most commonly occurs due to decreased blood volume (e.g., hemorrhage) or as a result of gravity pooling blood in the lower limbs when standing upright.
What is cardiac afterload?
Cardiac afterload is the pressure that the ventricles have to generate in order to pump the blood out of semilunar valves. The pressure in the aorta is approximately 80 mmHg and the pressure in the pulmonary trunk is 10 mmHg.
Changes in cardiac afterload have a negative effect on stroke volume (SV). This means increased cardiac afterload decreases stroke volume and vice versa.
Cardiac afterload is also referred to as systemic vascular resistance (SVR). In normal patients, afterload is thought to be proportional to systemic vascular resistance.
For example, if the patient has increased systemic vascular resistance due to any reason (i.e., by vasoconstriction or congenital disabilities like pulmonary hypertension and aortic stenosis). In that case, the afterload also increases to overcome systemic vascular resistance.
What is the effect of afterload on cardiac output?
In contrast to preload, afterload has the opposite effect on cardiac output.
As a result, decreased afterload increases cardiac output and vice versa.
Factors affecting cardiac afterload
Multiple factors affect the cardiac afterload. Following the factor that increases and decreases the heart’s afterload.
What are the factors that increase cardiac afterload?
The following factors increase cardiac afterload:
- Pulmonary hypertension increases blood pressure in the right lungs. Therefore, it increases afterload to overcome pulmonary pressure.
- High blood pressure increases the afterload on the ventricle, as the left ventricle has to overcome the pressure to pump blood out of the ventricle into the aorta. Because the aortic valve will never open until the left ventricle pressure becomes greater than the pressure in the aorta.
- In aortic regurgitation, the small volume of blood from the pumped blood comes back through the abnormal aortic valve. This increases afterload.
- Aortic stenosis frequently increases afterload during the natural aging process.
What are the factors that decrease cardiac afterload?
The following factors decrease cardiac afterload.
- When systemic vascular resistance is decreased by the use of vasodilator agents like nitroglycerine.
- Mitral regurgitation in which aortic pressure is decreased.
- The use of blood pressure-lowering agents like diuretics, angiotensin-converting enzyme inhibitors, and calcium channel blockers.
What is cardiac contractility (myocardial contractility)?
Cardiac contractility or myocardial contractility refers to the ability of the ventricles to contract during the systolic phase.
In other words, the force with which ventricular ejection occurs is called contractility of the heart.
What are the factors affecting cardiac contractility?
Several factors affect the contractility of the heart.
Factors that increase cardiac contractility are:
- Hormonal changes. For example, adrenaline, glucagon, and thyroxine increase cardiac contractility.
- Activation of the parasympathetic nervous system also increases the heart’s contractility due to noradrenaline release.
Factors that decrease cardiac contractility are:
- Increased hydrogen ion concentration in the blood (known as acidemia).
- Increased potassium level in the blood (known as hyperkalemia)
Cardiac Preload vs Afterload vs Contractility
| Preload | Afterload | Contractility | |
| Definition | Stretch in the cardiac muscle just prior to its contraction. This force is made up of the VOLUME of venous return that fills the heart. | The amount of PRESSURE the ventricle must overcome to eject blood out of the arteries. | The ability of the ventricles to CONTRACT during the systolic phase. |
| Affecting factors | Amount and rate of venous return | SVR and pulmonary vascular resistance | Autonomic innervation |
| Occurrence r/t cardiac cycle | During diastole | During systole | Systolic phase |
| Type of parameter | Preload is a volume | Afterload is a pressure | Contractility is a force |
How to remember cardiac preload and afterload and contractility?
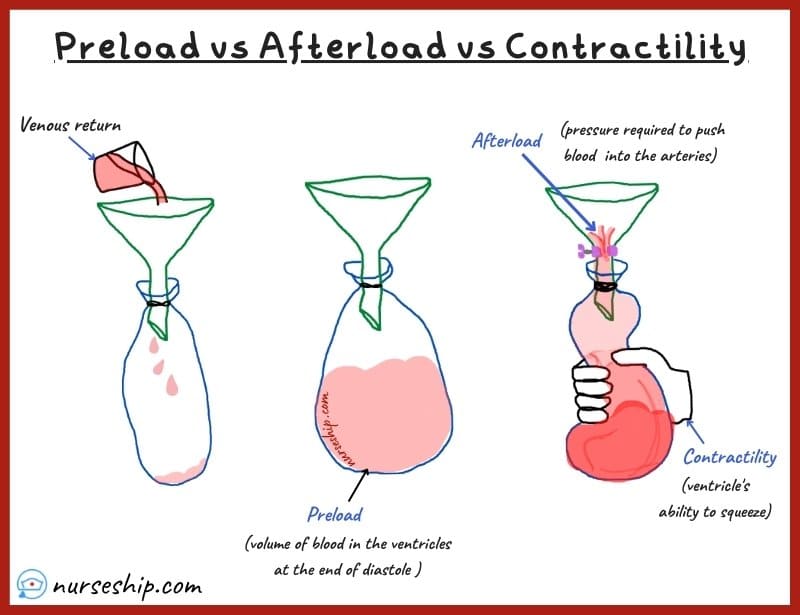
The water and balloon analogy is an easy way to remember the heart’s preload and afterload and contractility.
For example, (refer to fig.1) in this parallel, when a balloon is attached to a funnel and the balloon is in its normal deflated state. This can be considered the resting (or diastolic phase).
During this phase, you fill the balloon with water and it expands to its maximum stretch to accommodate water. The filling of water can be considered a venous return. The maximum stretch of the ventricle occurs right at the end of diastole just before systole.
This maximum stretch of the ventricles to contain the maximum volume of blood at the end of diastole is known as cardiac PRELOAD.
After the balloon is filled with water to its maximum capacity. Imagine that the funnel’s neck has a valve this time. Then, by squeezing the balloon, you attempt to push water back up into the funnel. Your squeezing creates sufficient pressure to open the valve and force the water back into the funnel.
In the heart, this squeezing occurs during the systolic phase and it is known as cardiac CONTRACTILITY; the pressure that is generated during contraction to open semilunar valves which allow blood flow into the arteries is known as cardiac AFTERLOAD.
Remember
A (afterload) is a P (Pressure)
P (Preload) is a V (Volume)
C (contractility) is a C (contraction)
Important terms, definitions, and formula
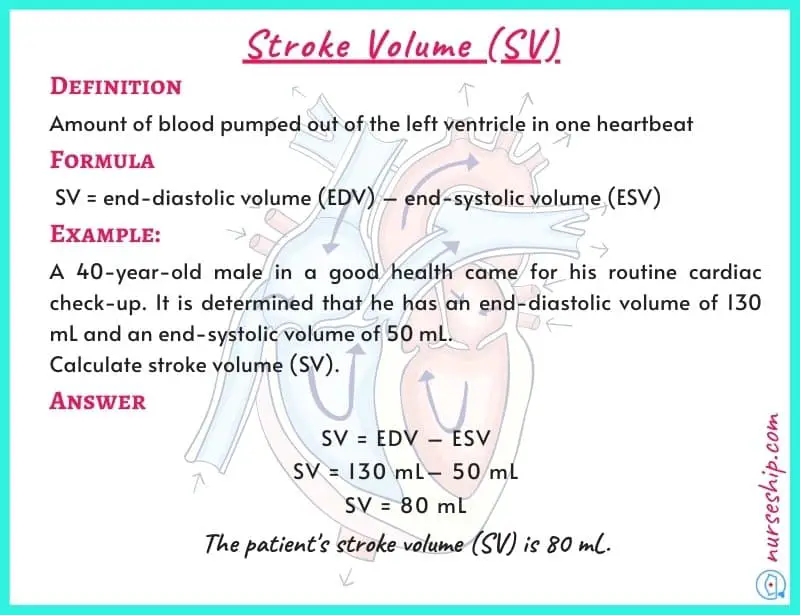
Stroke volume (SV)
Stroke volume is the amount of blood pumped out of the left ventricle in one heartbeat.
Factors that affect stroke volume are cardiac preload, afterload, and contractility.
The normal range of stroke volume (SV) is 50 – 100 ml.
Stroke volume is calculated using the following formula.
Stroke volume (SV) = end-diastolic volume (EDV) – end-systolic volume (ESV).
Example:
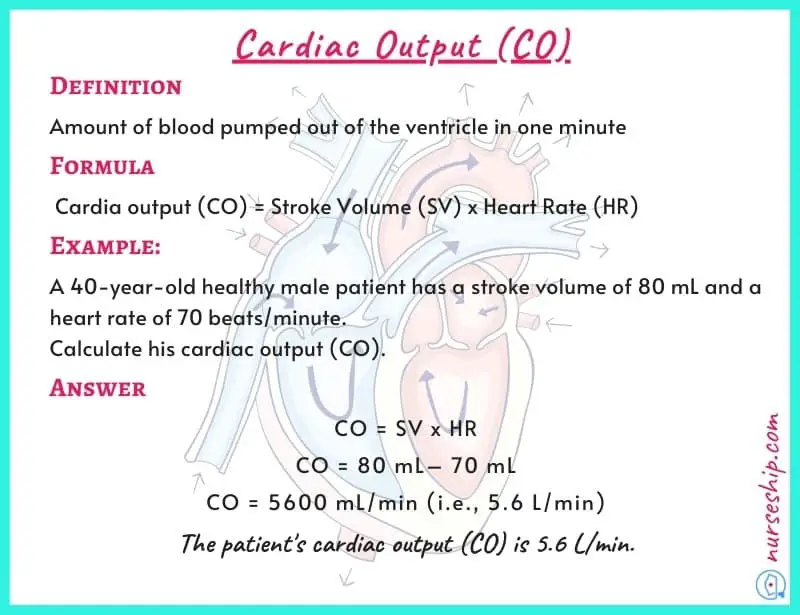
Cardiac output (CO)
Cardiac output is the amount of blood pumped out of the ventricles in one minute.
The normal cardiac output for an average adult is 5 – 6 liters/minute.
CO is essential for tissue perfusion. If cardiac output becomes insufficient, tissue perfusion to the cells that make up our tissues and organs decreases. When tissue perfusion decreases, cells receive insufficient oxygen and die.
Cardiac output is calculated using the following formula.
Cardiac output (CO) = Stroke volume (SV) x Heart rate (HR)
Example:
What is the difference between stroke volume and cardiac output?
| Stroke Volume | Cardiac Output | |
| Definition | Volume of blood pumped out of the left ventricle in SINGLE HEARTBEAT | volume of blood pumped out of the ventricles in ONE MINUTE |
| Normal range | 50 – 100 ml | 5 – 6 liters/minute |
The amount of blood pumped out of the left ventricle in one heartbeat is referred to as stroke volume. Cardiac output, on the other hand, is the volume of blood pumped out of the ventricles in one minute.
Heart rate (HR)
Heart rate is the number of heartbeats per minute.
To determine heartbeat you count pulse from any pulse point for one whole minute.
End-diastolic volume (EDV)
End-diastolic volume is the total volume of the blood in the ventricle right at end of the diastole.
The normal ranges of end-diastolic volume (EDV) are 106-214 ml for males and 86-178 ml for females. The average normal end-diastolic volume for adult males and females is 160 and 132 ml, respectively.
Also, remember that the heart does not pump out all the blood in the ventricle in one beat. The remaining blood after ejection is end-systolic volume.
End-systolic volume (ESV)
End-systolic volume is remaining blood in the ventricle after contraction (or systole).
The normal range of end-systolic volume (ESV) is 26-82 ml for males and 22-66 for females. The average normal end-systolic volume for adult males and females is 54 and 44 ml, respectively.
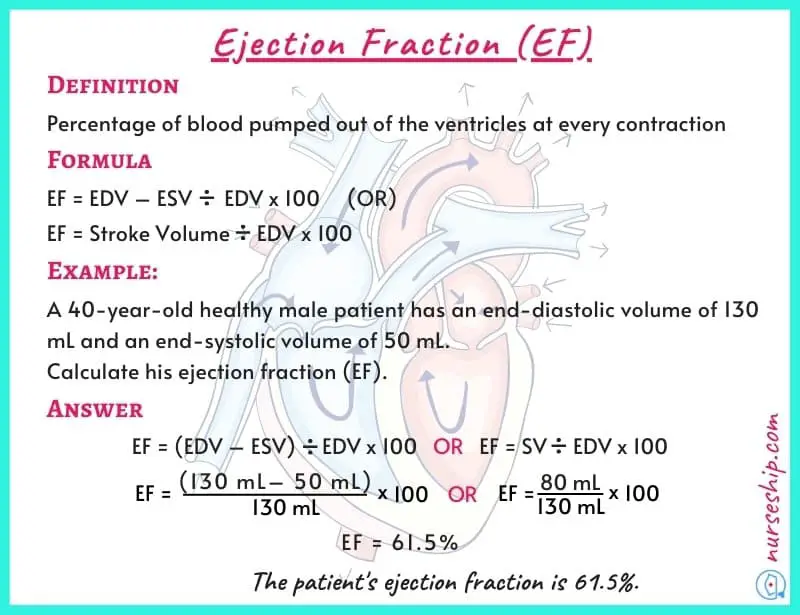
Ejection fraction (EF)
The ejection fraction is the percentage of blood pumped out of the ventricles at every contraction.
The normal ranges of ejection fraction (EF) are 57-77% for both males and females. The average normal ejection fraction is 67% for both genders.
The ejection fraction is calculated using the following formula.
Ejection fraction (EF) = [End-diastolic volume (EDV)] – [End-systolic volume (ESV)] / End-diastolic volume (EDV) x 100
Example:
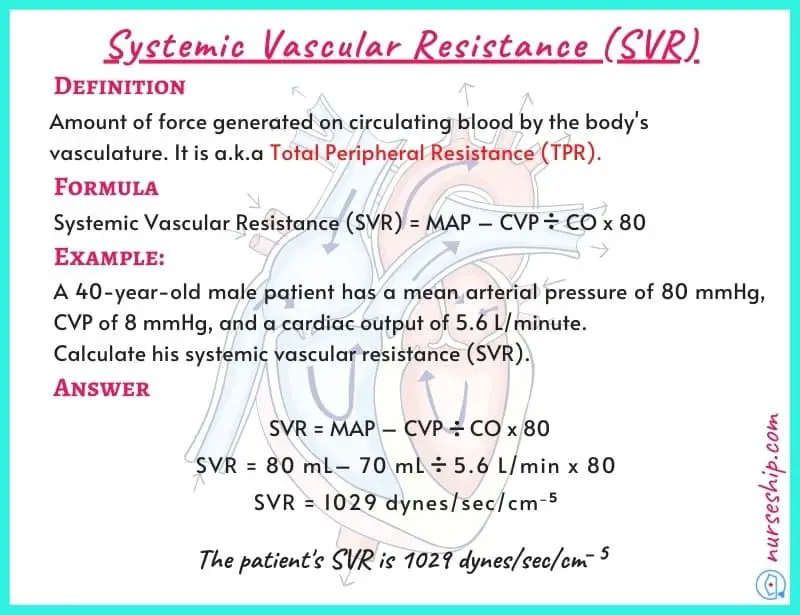
Systemic vascular resistance (SVR)
Systemic vascular resistance is the amount of force generated on circulating blood by the body’s vasculature. It is also known as total peripheral resistance (TPR).
Normal range of systemic vascular resistance (SVR) is 900 – 1440 dyne/s/cm−5
Systemic vascular resistance is calculated using the following formula.
Systemic vascular resistance (SVR) = [mean arterial pressure (MAP)] – [central venous pressure (CVP)] x 80.
Example:
Conclusion
To sum up, cardiac preload is related to the heart’s volume of blood returns from the venous returns; afterload is related heart’s pressure that needs to eject the blood out of the heart into the rest of the body, and the contractility is related to heart’s ability to squeeze blood out of ventricles.
Preload, afterload, and contractility are the main factors that determine the stroke volume (SV) of the heart. The SV affects the cardiac output (CO), which is crucial for tissue perfusion.
Reference
Lippincott Williams & Wilkins. (2009). Anatomy & Physiology Made Incredibly Easy! (3rd ed.).
Laizzo, P. (2015). Handbook of Cardiac Anatomy, Physiology, and Devices (3rd ed.). Springer International Publishing Switzerland.
Thompson, G. (2015). Understanding Anatomy & Physiology: A visual, auditory, interactive approach (2nd ed.). F. A. Davis Company.